The rising interest rate environment is making fixed deposits appear more attractive.
Unfortunately, things are not always what they seem, so it’s important to be careful when comparing quoted interest rates. This is because, in many cases, fixed deposits are quoted as ‘interest to maturity’, which is a euphemism for ‘simple interest rate’ and differs from the standard yield-quoting convention of fixed income securities, which are usually quoted as nominal annual compounded semi-annual rates (NACS).
These rates can be very different. For example, a three-year fixed deposit, which is currently quoted with an ‘interest to maturity’ of approximately 9.7% has the equivalent NACS yield of 8.7% – a difference of 1%. When converting this simple interest rate into its NACS equivalent, the average difference over time can equate to around 100 basis points.
This means that when comparing three-year fixed deposit rates, you can typically subtract up to 1% from the quoted yield before comparing it to the yield offered by other fixed income securities!
Yield is not the be-all and end-all
Importantly, in a rate-hiking cycle like the one we are currently experiencing, cash yield does not need to be the only source of return.
The chart below illustrates the real interest rate path of each hiking cycle in the past 20 years (2002, 2006 – 2008, 2014 – 2016, and the current cycle, starting in 2021). In analysing these previous hiking cycles, we found that the 2014 – 2016 cycle most closely represents the current environment. This is because both now and in 2014, the starting real rate – the current repo rate minus future inflation expectations – is/was negative.
Figure 1: The path of real interest rates in previous rate hiking cycles
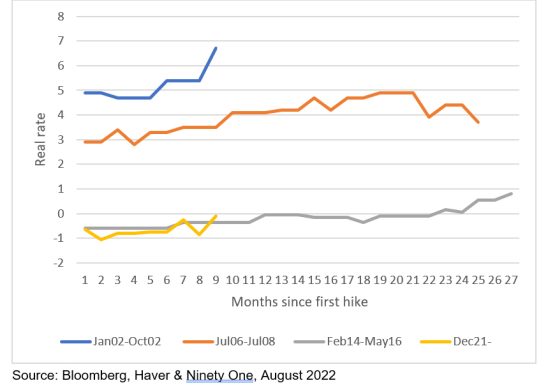
We also noted that the difference in interest rates (often referred to as the spread) between three-month cash and three-year fixed deposits was at its widest at the beginning of each hiking cycle. This spread then typically narrowed as short-term cash interest rates priced in subsequent increases in the repo rate. This resulted in subsequent three-year annualised cash returns typically outperforming their starting yields by approximately 1% p.a. in a rate-hiking cycle.
What delivered the better investment outcome?
To determine whether a flexible fixed income unit trust fund (for which we used the Ninety One Diversified Income Fund as proxy) or a three-year fixed deposit would have delivered a better outcome for investors during the rate hiking cycle of 2014 – 2016, we compared the differences in total return and yield. The below chart deconstructs the analysis, with the solid gold line showing the annualised return of the three-year fixed deposit, versus the return decomposition of the Ninety One Diversified Income Fund. Where the stacked bars are above the solid gold line, the Ninety One Diversified Income Fund outperformed the three-year fixed deposit, and vice versa:
- The blue bars are the initial cash yields. During the early stages of a hiking cycle, this yield is lower than its level at the end of the cycle. However, the spread between cash yields and fixed deposits tightens as cash rates increase further into the rate-hiking cycle, as increases in the repo rate start to take effect.
- The orange bars show the performance of cash relative to its own initial yield. You can see that cash positively outperforms its initial yield over a three-year horizon. This means that you would typically receive close to 1% more than what the cash yield implies at inception.
- The grey bars illustrate the annualised return above three-month cash delivered by the Ninety One Diversified Income Fund, affirming the benefits of a flexible fixed income mandate and active portfolio management, as discussed further below.
It is worth noting the material impact of ‘Nene-gate’ on financial markets post the shock firing of then Finance Minister Nhlanhla Nene in December 2015, and the resultant short-term underperformance of the Ninety One Diversified Income Fund in December 2015 and early 2016: the short-term spike in yields provided investors with a unique opportunity to lock-in very attractive term deposit rates.
Figure 2: Comparing the total return of the Ninety One Diversified Income Fund and a 3-year fixed deposit

In summary, during the previous rate hiking cycle the flexible fixed income unit trust fund, as represented by the Ninety One Diversified Income Fund, outperformed three-year fixed deposits approximately 90% of the time, with an average outperformance of almost 0.2% per annum. Investors also enjoyed the added benefit of almost immediate access to their money, as opposed to locking it up for three years.
Given the uncertain political, economic and investment environment, the decision to lock up money at a fixed rate may prove riskier than investors realise.
Paul Hutchinson is a sales manager within Ninety One’s South African advisor team.
Stay connected with us on social media platform for instant update click here to join our Twitter, & Facebook
We are now on Telegram. Click here to join our channel (@TechiUpdate) and stay updated with the latest Technology headlines.
For all the latest Business News Click Here
For the latest news and updates, follow us on Google News.
Denial of responsibility! NewsAzi is an automatic aggregator around the global media. All the content are available free on Internet. We have just arranged it in one platform for educational purpose only. In each content, the hyperlink to the primary source is specified. All trademarks belong to their rightful owners, all materials to their authors. If you are the owner of the content and do not want us to publish your materials on our website, please contact us by email – [email protected]. The content will be deleted within 24 hours.