Receive free Visual and data journalism updates
We’ll send you a myFT Daily Digest email rounding up the latest Visual and data journalism news every morning.
Only a handful of European countries have successfully decarbonised, despite the EU’s commitment to reach net zero emissions by 2050, according to data from energy think-tank Ember.

Sweden was the first member state to fully eliminate fossil fuels in electricity production, using a mixture of nuclear and renewables. Poland, on the other hand, is the most reliant on fossil fuels, which still accounted for 75 per cent of production.
Germany, Europe’s largest producer of renewable energy, phased out nuclear power entirely in April 2023, and continues to use significant amounts of coal. The government plans to close all coal plants by 2038.
Jonathan Vincent
Our other charts of the week

Hungary, Slovakia and the Czech Republic are the countries most exposed to automation, where it could affect more than one-third of the labour force, according to a new OECD report. In contrast, the UK and Luxembourg are the least exposed, with only 19 per cent and 17.7 per cent of their workforces at risk.
The jobs most under threat are in low- and middle-skilled jobs, such as construction, farming and transportation, whereas high-skilled occupations such as management and social service occupations are still at low risk from being automated, despite advances in artificial intelligence.
The report found that while AI has replaced certain tasks in high-skilled occupations, many skills still relied on human labour.
Joanna S Kao

As Joe Biden, 80, and Donald Trump, 77, look at 2024 presidential runs, roughly half of Americans considered 50-59 the best age for a commander-in-chief while more than a quarter thought 60 or older was the optimum age, according to Pew Research Center.
Twenty per cent of all respondents opted for a president in their 30s or 40s as ideal but that figure rose to 48 per cent among adults under 30.
Of the 46 US presidents, 54 per cent have been in their 50s at inauguration, with 26 per cent older and 20 per cent younger. The youngest elected president was John F Kennedy at 43. (Teddy Roosevelt was 42 on taking office in 1901 after McKinley’s death.)
Ian Bott

The production of palm oil and other commodities accounted for the majority of tree-cover loss between 2000 and 2021 in Latin America and the Caribbean and east Asia and the Pacific, according to data from the World Bank.
All tree-canopy loss is detrimental for the climate and biodiversity, but the most lasting damage is caused by permanent factors, such as urbanisation and the production of soy, beef and other commodities.
Between 2000 and 2021, 11 per cent of global tree cover was eradicated. The area lost in 2021 alone was comparable in size to the UK.
Amy Borrett

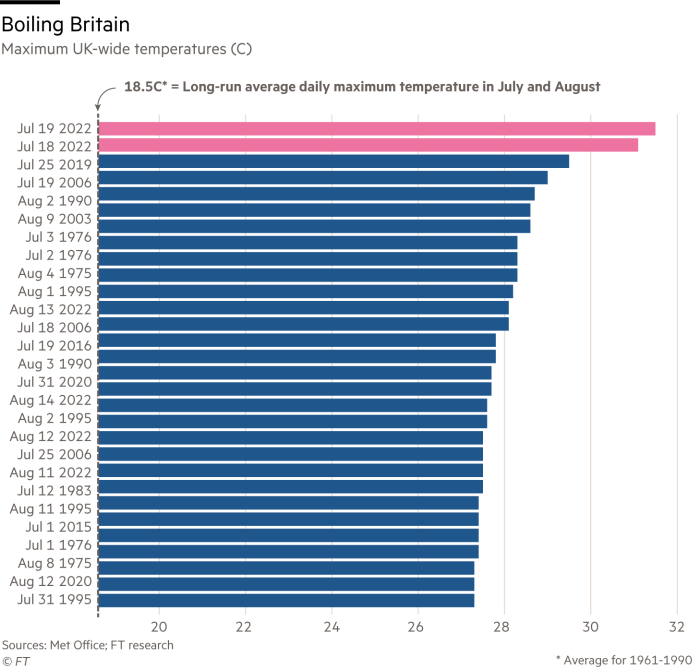
Exactly a year ago today, the UK hit a record average maximum daily temperature across the country of 31.5C, beating the previous high of 31.1C reached the day before, according to the Met Office.
Temperatures in some places rose above 40C for the first time. Coningsby in Lincolnshire holds the record for the hottest day ever in the UK, reaching 40.3C on July 19, surpassing the previous record by 1.6C.
The long-run average daily maximum temperature in the UK in July and August is just 18.5C, but summers are heating up. June 2023 was the warmest since 1884, with a provisional average UK temperature 2.5C above average.
Graham Parrish
Welcome to Datawatch — regular readers of the print edition of the Financial Times might recognise it from its weekday home on the front page.
Do you have thoughts on any of the charts featured this week — or any other data that has caught your eye in the past seven days? Let us know in the comments.
Keep up to date with the latest visual and data journalism from the Financial Times:
-
Data Points. The weekly column from the FT’s chief data reporter John Burn-Murdoch.
-
Climate Graphic of the Week is published every week on our Climate Capital hub page.
-
Sign up to The Climate Graphic: Explained newsletter, free for FT subscribers. Sent out every Sunday, a behind-the-scenes look at the most topical climate data of the week from our specialist climate reporting and data visualisation team.
-
Follow the FT on Instagram for charts and visuals from significant stories.
-
Follow FT Data on Twitter for news graphics and data-driven stories from across the FT.
Stay connected with us on social media platform for instant update click here to join our Twitter, & Facebook
We are now on Telegram. Click here to join our channel (@TechiUpdate) and stay updated with the latest Technology headlines.
For all the latest Business News Click Here
For the latest news and updates, follow us on Google News.
